|
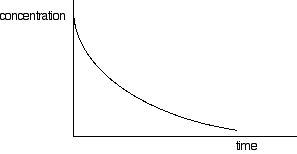
Chemguide: Support for CIE A level Chemistry Learning outcomes 8(h) and 8(g)(ii) This statement is about concentration against time graphs in rate of reaction work, and their relationship with the half-life of a reaction. I have also included statement 8(g)(ii) on this page because it is closely related. Before you go on, you should find and read the statements in your copy of the syllabus. Quite a lot of this is covered in detail in my chemistry calculations book. What follows is a brief summary. Concentration-time graphs for zero and first order reactions Concentration-time graphs for a zero order reaction Assume that you have a reaction which involves a single reagent A. Under some rather special circumstances, the rate of reaction may not be affected by the concentration of the reagent. This can happen, for example, where the reaction is taking place on the surface of a catalyst, where the concentration of A is high, and all the active sites on the catalyst are already fully used by the reactant. Increasing the concentration of A can't make any difference, because the catalyst is already working as fast as it can. Normally, when you plot a graph of concentration of a substance against time, it looks something like this:
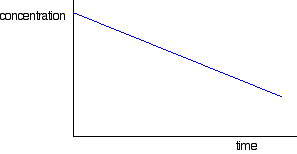
The curve starts off falling steeply, but then gets gradually less steep. That is because the concentration is falling, and rate is normally dependent on concentration. So what happens if the rate is independent of concentration, as in a zero order reaction? In this case, the rate of reaction won't change as the concentration of the substance falls over time. If the rate doesn't change, that means that the slope of the curve doesn't change - and so you will get a straight line rather than a curve.
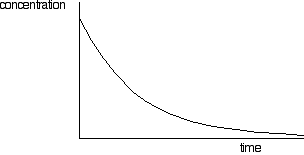
If you draw a graph like this for a zero order reaction, be careful not to extend it too far. Eventually the concentration will get low enough that the special circumstances which caused the reaction to be zero order won't apply any more. It will start to curve at that point. Concentration-time graphs for a first order reaction First order reactions will have a curve if you plot concentration against time (but so will other orders as well - apart from zero order). A typical first order curve will look like this:
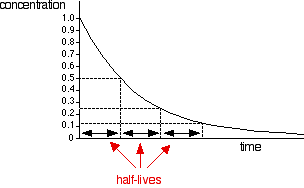
But you can't tell it is first order just by looking at it. A second order curve isn't hugely different. It starts more steeply, but you need to investigate the curves more carefully to be sure. And this is where the concept of half-life comes in. The half-life of a reaction is the time it takes for the concentration of a substance to fall to half of its original value. For a first order reaction (but only for a first order reaction), the half-life is constant. It doesn't matter what concentration you start with, it will take exactly the same time for the concentration to reach half of that value. You can easily discover this from a graph of concentration against time. You simply have to measure how long it takes for the concentration to fall from its original value to half of that value; then measure it from a half to a quarter; then from a quarter to an eighth. Or you could measure it from the original 100% to 50%, and then compare that with the fall from 80% to 40%, and from 60% to 30% - or any other combination of concentrations, as long as you are measuring the time taken to halve the concentration. Looking at this on a graph:
. . . you can see that the time taken to halve the concentration is always the same. If you did this for a reaction with some other order (second order, for example, or some fractional order), then the values won't be constant. This isn't a problem you need to worry about for CIE purposes. All you need to recognise is that the concentration against time curve for:
The relationship between half-life and rate constant for a first order reaction Half-life is given the symbol t½. For first order reactions there is a simple relationship between this and the rate constant for the reaction, k.
This only applies to first order reactions. "ln 2" is the natural logarithm of 2. If you have no idea what that means, it doesn't matter in the least. Somewhere on your calculator is a button marked "ln". Most calculators probably want you to enter the number 2 and then press the ln button. It may be that yours does it the other way around. If you get it wrong you will just get an error message. You will find it gives an answer of 0.69314718. CIE round this off for you to 0.693, and actually expect you to remember the relationship as:
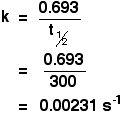
Learn it! You can't do these simple sums without it. Example 1 If the half-life of a first order reaction is 300 seconds, calculate the rate constant for the reaction.
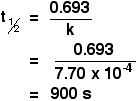
Why are the units s-1? 0.693 has no units, and the units of half-life are seconds (s). The unit s was on the bottom of the fraction, and you need to write the units on the same line as the answer. To move the unit to the top, you have to change the sign, giving s-1. Example 2 If the rate constant of a first order reaction is 7.70 x 10⁻⁴ s-1, calculate the half-life of the reaction. First, you will have to rearrange the expression to let you calculate half-life.
Provided you know the equation, these calculations are trivial.
© Jim Clark 2011 (last modified August 2013) |
